Madison River Hatches: Macroinvertebrate Report Summary
- edgeoutfitting
- May 10, 2025
- 10 min read
WARNING: This article gets nerdy and dense quick...proceed with caution.
NorthWestern Energy, as part of its hydroelectric operating responsibilities, has conducted annual benthic macroinvertebrate (BMI) surveys since 1995 on the Madison and Missouri Rivers. This 2024 report includes data collected from August 13-15 and compares it to nearly 30 years of prior data. BMI simply stands for benthic (bottom dwelling), macro (tiny), invertebrate (lacking a backbone; a bug). Almost all the insects we imitate as fly fishers are these. Exceptions would include obviously terrestrials like hoppers, ants, and beetles.
Monitoring occurs at 11 sites ranging from Yellowstone National Park to downstream points on the Madison and Missouri Rivers. Madison River sites (7) include inside Yellowstone National Park near the USGS gauge in West Yellowstone (YNP), just below Hebgen Dam (HEB), Kirby Ranch (KIR), and Ennis Campground (ENN) on the Upper Madison. On the Lower Madison, sites include below Ennis Lake at the Power House (MPH), above Norris Bridge (NOR), and lastly at Greycliff Fishing Access (GCF). Five samples per site were collected using a kick-net, targeting a variety of stream habitats with varying depth and velocity at each site. Samples were sieved and preserved in ethanol for lab analysis.
River flow patterns, particularly spring peaks, affect stream health. High spring flows play an important role by redistributing sediments, flushing silts from gravels and reducing rooted aquatic vegetation. While frustrating to anglers, those days and weeks of high muddy flows are very important for our bugs and fish. Both the magnitude of the spring flushing flow and the volume of water annually transported through the system is important for maintaining water temperatures and engaging available stream channel habitats.
So, regarding stream health, everything always comes back to an abundance of cold, clean water. The more you have the better. The less you have, well, things begin to unravel. Some streams fare worse than others depending on a variety of variables. Here on the Upper Madison, we’re somewhat lucky to have reservoirs which can hold back water for drought. Water released from the bottom of Hebgen can help mitigate scorching summers. But we’re not immune from lacking cold, clean water. In fact, based on USGS records from 1995 to 2024, the 30-year mean annual discharge below Hebgen Lake is 1,027 cfs and this has been trending downward suggesting that we’re losing cold, clean water inputs slowly but surely. And ultimately, this should be the root cause of all concerns regarding our fisheries in my opinion. Even on the Upper Madison, which we traditionally view as a very healthy stream, we’re already seeing impacts to this reduction of cold, clean water. More on that in a moment.
Mean annual discharge in 2024 (898 cfs) is below the long-term average, but higher than than the 2 lowest discharge years in 2021 and 2022 (Figure 1b). Apart from 2017-2020, mean Madison River discharge has been below average since 2012. Peak flow in 2024 at Hebgen was recorded on July 20th at 1,470 cfs; this peak was ~1,320 cfs lower than in 2023 and occurred 8 weeks later. We as anglers and conservationists ought to be hyper focused on conserving every ounce and cubic feet of water. Everything comes back to this.

Bug densities, taxonomic composition, and biointegrity scores for 2024 are all reported and compared to the previous 29 years in the latest summary. Community composition is reported as the percent relative abundance of five major Insect Orders (mayfly, stonefly, caddisfly, riffle beetles, and diptera) and the non-insect invertebrates (primarily aquatic worms, snails, isopods and amphipods). Relative abundance simply means what percentage of each sample does a particular bug (referred to as a taxa) or Order of bugs represent. Oftentimes in macroinvertebrate reports you may also see the acronym EPT. EPT simply refers to three different Orders of aquatic insects that are both important to fly fishers and to scientists. It stands for Ephemeroptera (mayflies), Plecoptera (stoneflies), and Trichoptera (caddisflies). We as fly fishers commonly tie on patterns to imitate these particular orders of insects and scientists lump them all together in one big category for purposes of measuring stream health. EPT species are generally intolerant to many pollutants in a stream and thus the fewer and less diverse your EPT counts are the more indicative it is of impairment and vice versa. There are some EPT species which are exceptions to this rule though. Other orders like Diptera (midges) are generally more tolerant of pollutants. So that can be another measure of stream health. A disproportionate amount of midges coupled with low amounts of EPT likely means stream health is not as healthy as it could be.
Approximately 154,615 macroinvertebrates (± 8,100 individuals) from 55 samples were collected at 11 sites on the Missouri and Madison Rivers during August 2024; this is significantly lower than the number of individuals collected in 2023 (~179,500) due to large decreases in the BMI densities at Hauser (HAU), Holter (HOL) and Morony (MOR) on the Missouri.

The 5 kicknet samples provide an estimate of BMI densities. The mean number of BMI per square meter in 2024 was 11,304 individuals and ranged from about 2,500 at YNP to ~21,600 below Madison Power House (MPH). The 2024 BMI density estimates at all three Upper Madison sites were substantially higher than the 10 year average (Figure 2). That seems good. But let’s dig deeper.
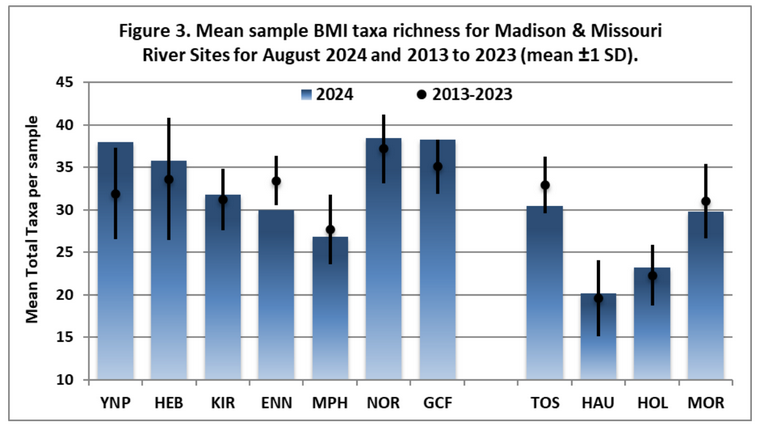
Overall, 2024 mean BMI species richness per sample (how many different species were found in a sample) in the Upper Madison River was significantly above average for YNP and GCF, slightly above average for HEB, KIR and NOR, and below average for ENN and MPH. (Figure 3)
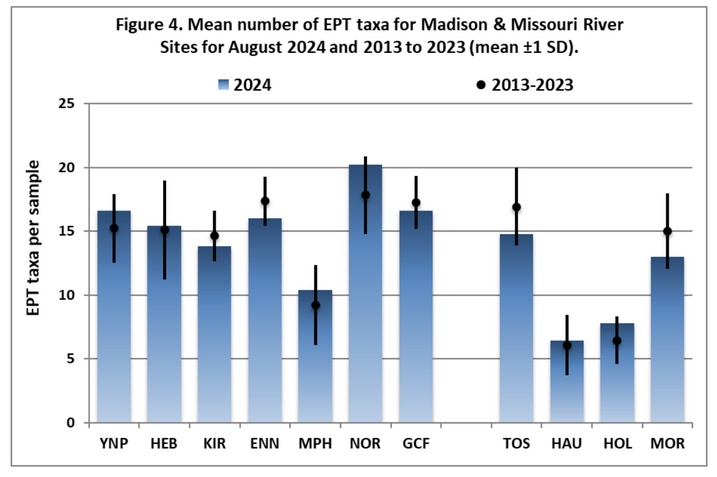
In 2024, 4 sites in the Madison River were slightly exceeding the long-term average mean EPT species richness per sample (YNP, HEB, MPH and NOR), while 3 sites (KIR, ENN and GCF) report slightly below average EPT species richness per sample compared to the last decade (Figure 4). The largest increases in EPT species per site were YNP and NOR with 4-5 additional EPT species above the long-term average. Mean 2024 EPT richness per Madison River site averaged ~16; these ranged from a low 11 EPT species at the Madison Powerhouse (MPH) to a high of 20 EPT species at Norris (NOR).
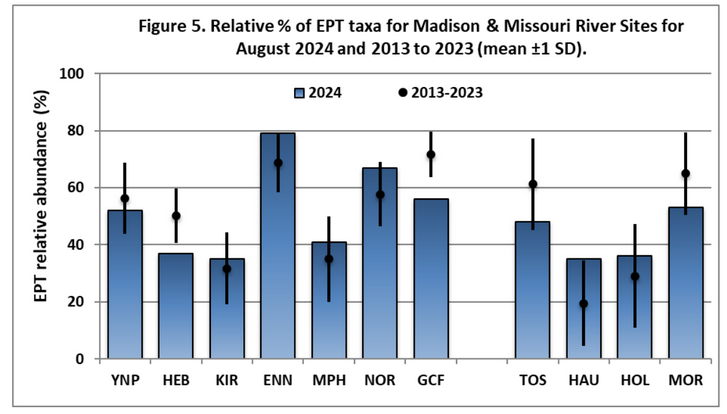
For 2024, EPT relative abundance (% EPT; what percentage of each sample do EPT bugs represent) was substantially below average at 3 Madison River sites (YNP, HEB and GCF) and within or slightly above the decadal average for 4 sites (KIR, ENN, MPH and NOR) (Figure 5). This is a pretty important measurement. For both anglers and scientists. If we like fishing Baetis, caddis and massive stonefly dries, the fish aren’t going to take them if they don’t regularly see them. And if the EPT counts are dropping from historical averages, this should raise our antenna. We know from other NWE reports on water chemistry that we really don’t have a pollution problem here on the Madison. So, again, we need more cold, clean water. Despite reporting slightly above average % EPT taxa in 2024, Kirby continues to significantly decrease the % EPT comprising the BMI assemblage in the samples. The mean % of EPT taxa across the Madison River sites in 2024 was ~52%; scores ranged from 35% at KIR to a high of 79% at Ennis (ENN) (Figure 5); Ennis reported an all time high of 87% EPT taxa in 2021. ENN and NOR were the only 2 sites reporting values above the minimally impaired threshold of the % EPT metric (>60%).
Kirby and Ennis are two interesting stories in recent years. The dearth of EPT at Kirby is coupled with the increasing amounts of snails. Not necessarily the bad snails we think of like New Zealand Mud snails (although we do have those in small amounts unfortunately), but other native snails. Large spikes in snails in a stream have been shown to be indicative of impairment. However, I’ve been to the site at Kirby and it’s on river left just below the turnaround upstream from the West Fork bridge. It’s at the bottom end of that side channel. That side channel in August when these samples are taken is almost always low, slow, and warm. Often with some algae. Perfect snail habitat. Not great EPT habitat. So, perhaps the Kirby area isn’t impaired as much as we think, but that the exact site where the samples are taken is just not ideal? I don't know, but it’s just an idea. If they moved it out into the stream 50 feet I bet they get a much different sample. I’ve asked about this, and I’m curious what they say.
Caddisflies were widely distributed and numerically dominant at four of seven sites on the Madison River (YNP, ENN, MPH and NOR) (Figure 6). Caddisfly numbers increased substantially below the Madison Powerhouse (MPH) in 2023 and continued this in 2024 (Figure 6). Mayflies were also abundant throughout the drainages, and were most numerous in 2024 on the Madison river sites, HEB, NOR and GCF. In 2024, stoneflies accounted for a slightly lower average percentage 1.6% (0.9-2.5%) of the BMI communities from the upper Madison River than 1.98% in 2023 (0.8-3.7%), and were mostly absent from samples on the lower Madison River (0-0.8%) (Figure 6). The Madison River at YNP, HEB, KIR and ENN reported the highest % of stoneflies of 2024 samples at 2.5%, 1.8%, 1.1% and 0.9%, respectively; these were largely comprised of the golden stones Hesperoperla pacifica and Claassenia sabulosa (“nocturnals”), Pteronarcys californica (salmonflies) and Skwala. Of major concern to both scientists and anglers (and local businesses…), is the continuing decline of salmonfly range in the west. We no longer find salmonflies on the lower Madison. Ennis is likely the next area to lose these bugs without a turnaround in the supply of cold, clean water.
For context, first here is 2023’s relative abundance of major macroinvertebrate groups, followed by 2024.
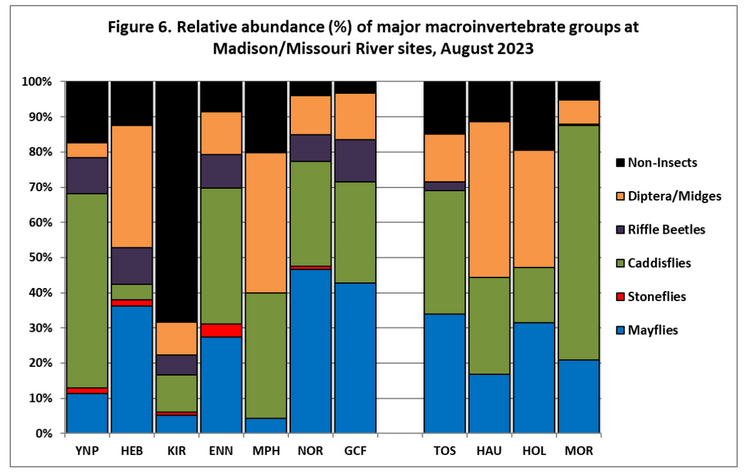
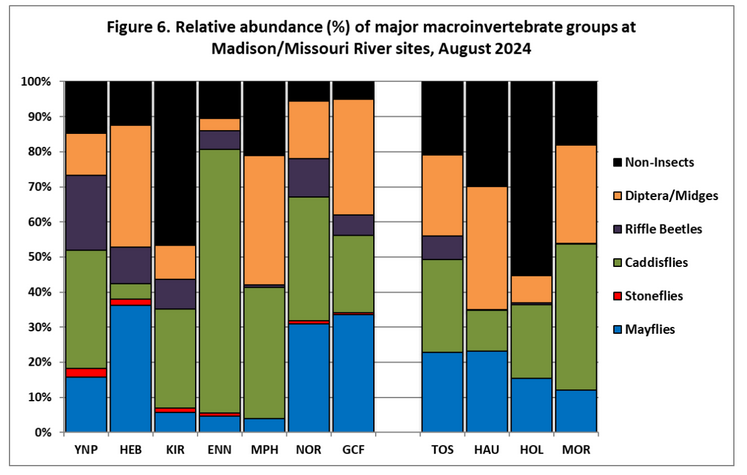
At Upper Madison sites, a few notable shifts from 2023 to 2024. First, in YNP, a sizable jump in caddis in 2024 largely at the expense of riffle beetles. At Hebgen, things didn’t change too much for the relative abundance of these categories. At Kirby we saw a rebound of caddis at the expense of non-insects which is a good direction to move. Ennis may have the most obvious change from 2023 to 2024 with the astronomical gains of caddis at the expense of most everything else. A near doubling of caddis abundance here took place in a year. And a marked reduction in mayflies and stoneflies. Nearly 75% of all bugs sampled in Ennis were caddis! That’s shocking. What’s more, of these caddis in Ennis, 59% (!) is represented by one species: Helicopsyche. If you ever pick up a rock and see small snail shaped cases made out of fine sediment and pebbles, that's these guys. Here’s a cluster of cases from last summer near the Ennis Bridge.
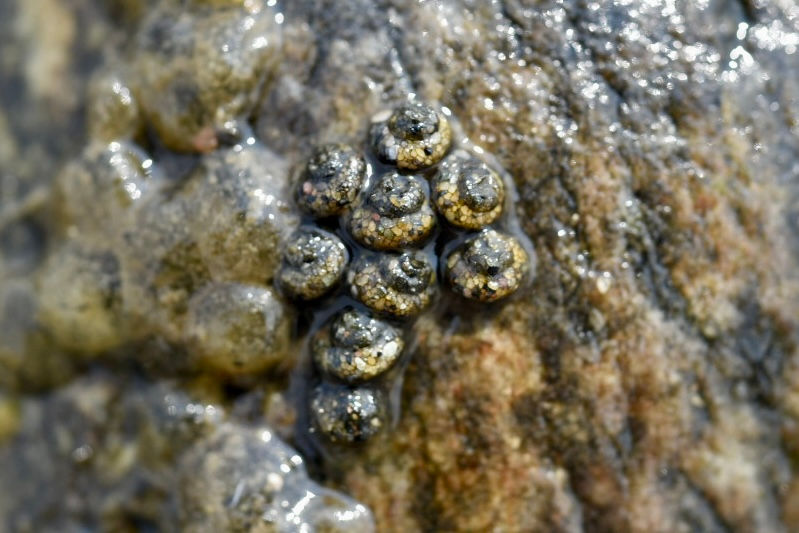
Beautiful. Nature is amazing sometimes isn’t it? These relatively small caddis (adults are roughly 7-8 mm - a size 20 ish) build these amazing cases shaped like snails out of pebbles and fine particles and can move around on the rocks like conch shells.
For perspective, right now we’re seeing hatches of our “Mother’s Day Caddis” in the lower reaches of the Upper Madison down through the Beartrap. A prolific bug. Brachycentrus is the genus. Brachycentrus in 2024 samples represented a whopping 0.8% relative abundance. Compare that to Helicopsyche with 59%! Helicopsyche hatch across a broad timeframe on the Madison. We can expect them to begin hatching below the Ennis bridge fairly soon and continue through August.
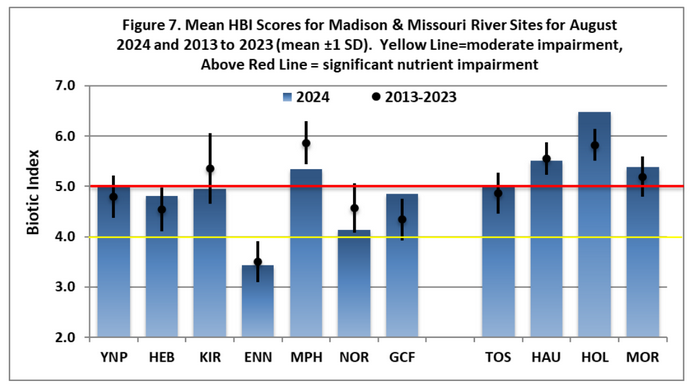
The biotic index was calculated for each site and is an informative stand-alone metric which measures the tolerance of a macroinvertebrate community to pollution and sedimentation (Figure 7). Tolerance values are based on a 0-10 scale, where zero-ranked species are most sensitive and 10-ranked species are most tolerant to pollutants. BI values of 0.0-3.0 indicate no apparent organic pollution (excellent), 3.0-4.1 possible slight organic pollution (very good), 4.1-5.0 moderate pollution, 5.0-6.0 fairly significant pollution, 6.0-7.0 significant pollution (fairly poor), 7.0-8.0 very significant organic pollution 8.0-10 severe organic pollution. It’s concerning that the bug composition at 3 of 4 Upper Madison sites are at or near the significant impairment threshold for this metric. Ennis remains consistently below even moderate impairment. In fact, it’s the only site out of all 11 in the Madison and Missouri sampling system to be below moderate impairment.

Multimetric bioassessment scores provide a measure of environmental stress associated with deviations from “natural” conditions. Higher scores (>75% of the total score) indicate healthier aquatic communities while lower scores reflect increasing environmental stressors (i.e. nutrient and sediment loads, altered discharge or thermal regimes (see Table 2, McGuire 2017 for metric descriptions, criteria, and interpretation). Overall, 2024 bioassessment scores were at or above average for 4 of the 6 sites in the Madison (YNP, ENN, NOR, GCF) (Figure 8). The three other sites in the Madison ranked significantly below the long-term average (HEB, KIR, MPH) (Figure 8). The Madison River had scores that ranged from 93% at YNP and Norris (NOR) to 60% at MPH (Figure 8). Although still below the impairment threshold, Kirby (KIR) has increased in biointegrity in 2024 (73%) from below 60% in 2023 (57%) after reporting a score of 80% in 2018.
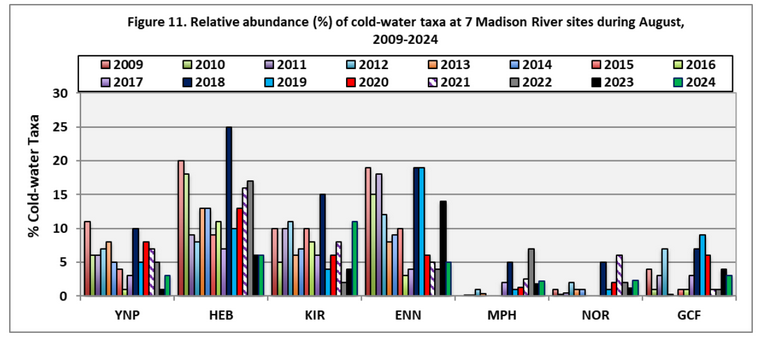
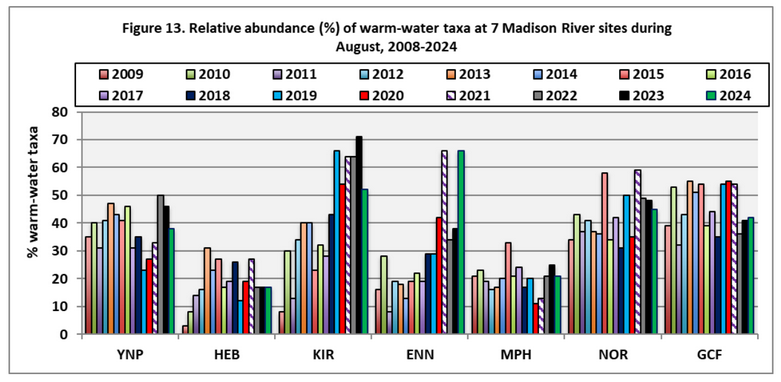
Relative abundances of cold-water species (thermal tolerance less than or equal to 64° F) and warm-water species (thermal tolerance greater than 72° F) are graphically presented for the past 15-years. To me, these graphs have a lot to say. First, look at the major dichotomy between upper and lower Madison River sites. The chronic elevated water temperatures we see each summer on the lower Madison clearly are impacting CW macroinvertebrates. The trend at YNP, KIR, and ENN are all dropping as well. And the ongoing dam repairs at Hebgen over the last 15 years have clearly had an impact on bug communities there (Fix Hebgen Dammit!). Normally the dam releases cold hypolimnetic water during the summer. However, due to construction at the dam, warmer surface water was released from 2009 through 2015 and again in 2017. Also note, the high water pulse years of 2018-2020 and the impact to an increase of CW taxa. But those increases didn’t last when lower flow regimes came back.

Here’s a breakdown of all the species found in Upper Madison River sites in 2024. Not all of these species are found at each of the three Upper Madison sites however. And secondly, this list is not exhaustive. The surveys will inevitably miss some bugs not just from physically catching them in the kicknet, but simply by timing of the survey. For example, Ephemeroptera (PMDs) are an abundant bug in Ennis. However, in the appendix of the survey, they were not found at all in kicknet surveys in Ennis. This may be due to the timing of the survey being too close to when current year PMDs have already laid eggs and died. The survey likely happens too soon to catch the next generation as discernible nymphs. That’s my best guess. The same goes for green drakes in Ennis. Because if you pick up a rock in town mid summer (July) you will inevitably see PMD and drake nymphs, but in August you may not. So why not have the survey in late winter/early spring when there are less bugs in the system as eggs and you’re likely to get a fuller representation of the suite of bugs in the system? Partly the answer to this is, this is how it’s always been done and a large part of the value of this survey is its longitudinal nature. 30 years of data in the same sites at the same time of year is pretty important to continue. If only we had started this survey at a better time of year to begin with…


Comments